| Jochem Lesparre |
| Jochem Lesparre |
| Geodesie |
| Geodesy |
Afstudeeronderzoek
![]() Mijn afstudeeronderzoek heb ik uitgevoerd bij de Meetkundige Dienst van Rijkswaterstaat. Doel van het afstudeerproject was het onderzoeken van de toepasbaarheid van een geavanceerde classificatie methode voor hyperspectrale beelden van natuurlijke vegetatie. Deze geavanceerde methode is een integratie van beeldsegmentatie en beeldclassificatie en is ontwikkeld voor multi-spectrale beelden van agrarische gebieden. Hier geeft deze methode een verbetering van de classificatie door naast de spectrale eigenschappen ook rekening te houden met de ruimtelijke samenhang. Natuurlijke vegetatie groeit niet zo gestructureerd als cultuurgewas, maar ook niet lukraak door elkaar. Daarom is ook voor natuurlijke vegetatie een verbetering te verwachten met deze methode. Ik heb onderzocht in hoeverre dit voor hyperspectrale beelden van de kwelder op Schiermonnikoog zo is en welke aanpassingen in de methode noodzakelijk zijn voor deze nieuwe toepassing. Dit heeft geleid tot de volgende publicaties:
Mijn afstudeeronderzoek heb ik uitgevoerd bij de Meetkundige Dienst van Rijkswaterstaat. Doel van het afstudeerproject was het onderzoeken van de toepasbaarheid van een geavanceerde classificatie methode voor hyperspectrale beelden van natuurlijke vegetatie. Deze geavanceerde methode is een integratie van beeldsegmentatie en beeldclassificatie en is ontwikkeld voor multi-spectrale beelden van agrarische gebieden. Hier geeft deze methode een verbetering van de classificatie door naast de spectrale eigenschappen ook rekening te houden met de ruimtelijke samenhang. Natuurlijke vegetatie groeit niet zo gestructureerd als cultuurgewas, maar ook niet lukraak door elkaar. Daarom is ook voor natuurlijke vegetatie een verbetering te verwachten met deze methode. Ik heb onderzocht in hoeverre dit voor hyperspectrale beelden van de kwelder op Schiermonnikoog zo is en welke aanpassingen in de methode noodzakelijk zijn voor deze nieuwe toepassing. Dit heeft geleid tot de volgende publicaties:
MSc thesis
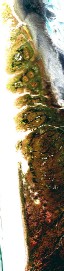
![]() I executed a project for my M.Sc. thesis at the Survey Department of the Dutch Ministry of Transport, Public Works and Water Management. The objective of the research was to test the applicability of an advanced classification method for hyper-spectral images of natural vegetation. The advanced method is an integration of image segmentation and classification, originally developed for multi-spectral images of agricultural areas. Here, this method provides improved classification, by considering spatial coherence next to spectral characteristics. Although natural vegetation occurs in a less orderly manner than agricultural crops, it also doesn't grow completely randomly. Therefore improvement by this method is expected for natural vegetation too. In my research I determent to what degree this is valid for hyper-spectral imagery of the salt march on the island Schiermonnikoog in the Wadden sea, to the North of the Netherlands, as well as the necessary adaptations in the method. This resulted in the following publications:
I executed a project for my M.Sc. thesis at the Survey Department of the Dutch Ministry of Transport, Public Works and Water Management. The objective of the research was to test the applicability of an advanced classification method for hyper-spectral images of natural vegetation. The advanced method is an integration of image segmentation and classification, originally developed for multi-spectral images of agricultural areas. Here, this method provides improved classification, by considering spatial coherence next to spectral characteristics. Although natural vegetation occurs in a less orderly manner than agricultural crops, it also doesn't grow completely randomly. Therefore improvement by this method is expected for natural vegetation too. In my research I determent to what degree this is valid for hyper-spectral imagery of the salt march on the island Schiermonnikoog in the Wadden sea, to the North of the Netherlands, as well as the necessary adaptations in the method. This resulted in the following publications:
Wat is geodesie?
Geodesie, dat ook wel geomatics of geo-informatica genoemd wordt, is de wetenschap die zich bezig houdt met de (voornamelijk geometrische) beschrijving van het aardoppervlak.
![]() Van oorsprong is de geodeet een landmeter die met behulp van zijn meetinstrumenten de aarde in kaart brengt. Een belangrijke reden voor het maken van een kaart is al sinds de oudheid het vastleggen welke grond van wie was. Daardoor houden ook nu geodeten zich nog bezig met eigendomsregistratie (kadaster).
Van oorsprong is de geodeet een landmeter die met behulp van zijn meetinstrumenten de aarde in kaart brengt. Een belangrijke reden voor het maken van een kaart is al sinds de oudheid het vastleggen welke grond van wie was. Daardoor houden ook nu geodeten zich nog bezig met eigendomsregistratie (kadaster).
![]() Maar landmeten is niet meer de enige manier om de aarde in kaart te brengen. Geodeten houden zich daarom ook bezig met luchtfotografie (fotogrammetrie), satellietbeeld-interpretatie (remote sensing) en plaatsbepaling met behulp van satellieten (zoals GPS). Verder bleek het voor nauwkeurige hoogtemetingen en de beschrijving van satellietbanen noodzakelijk te zijn het zwaartekrachtveld te bepalen (gravimetrie).
Maar landmeten is niet meer de enige manier om de aarde in kaart te brengen. Geodeten houden zich daarom ook bezig met luchtfotografie (fotogrammetrie), satellietbeeld-interpretatie (remote sensing) en plaatsbepaling met behulp van satellieten (zoals GPS). Verder bleek het voor nauwkeurige hoogtemetingen en de beschrijving van satellietbanen noodzakelijk te zijn het zwaartekrachtveld te bepalen (gravimetrie).
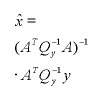
![]() Om alle ingewonnen meetgegevens te verwerken wordt er gebruik gemaakt van wiskundige technieken. Daarbij gaan bijvoorbeeld alle metingen samen met hun standaardafwijking in een model en komen er coördinaten met standaardafwijking weer uit (kleinste-kwadraten-vereffening).
Om alle ingewonnen meetgegevens te verwerken wordt er gebruik gemaakt van wiskundige technieken. Daarbij gaan bijvoorbeeld alle metingen samen met hun standaardafwijking in een model en komen er coördinaten met standaardafwijking weer uit (kleinste-kwadraten-vereffening).
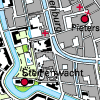
![]() Uiteindelijk moet de verkregen informatie opgeslagen of geanalyseerd worden. Traditioneel gebeurde dat met papieren kaarten, maar tegenwoordig digitaal in met een interactieve kaart die opgebouwd wordt uit een database (Geografisch Informatie-Systeem).
Uiteindelijk moet de verkregen informatie opgeslagen of geanalyseerd worden. Traditioneel gebeurde dat met papieren kaarten, maar tegenwoordig digitaal in met een interactieve kaart die opgebouwd wordt uit een database (Geografisch Informatie-Systeem).
What is geodesy?
Geodesy, also called geomatics or geo-informatics, is the science that studies the earth's surface (mainly in geometric way).
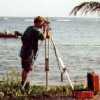
![]() Originally, a geodesist is a surveyor who maps the earth using his measurement instruments. For ages one important reason for making a map is to record which land is owned by whom. For that reason geodesists still engage in land registration (cadastre).
Originally, a geodesist is a surveyor who maps the earth using his measurement instruments. For ages one important reason for making a map is to record which land is owned by whom. For that reason geodesists still engage in land registration (cadastre).
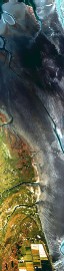
![]() But surveying is no longer the only way to investigate the earth's surface. Therefore, geodesists are also practising aerial photography (photogrammetry), interpretation of satellite images (remote sensing) and satellite positioning (like GPS). Furthermore, it appeared to be necessary to measure the gravity of the earth (gravimetry) for accurate height measurement and the determination of satellite orbits.
But surveying is no longer the only way to investigate the earth's surface. Therefore, geodesists are also practising aerial photography (photogrammetry), interpretation of satellite images (remote sensing) and satellite positioning (like GPS). Furthermore, it appeared to be necessary to measure the gravity of the earth (gravimetry) for accurate height measurement and the determination of satellite orbits.
![]() To process all these measurements mathematical techniques are used. For example one that has all the measurements, together with the standard deviations, as input and that outputs coordinates and standard deviations of the measured points (least squares adjustment).
To process all these measurements mathematical techniques are used. For example one that has all the measurements, together with the standard deviations, as input and that outputs coordinates and standard deviations of the measured points (least squares adjustment).
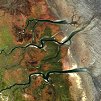
![]() Finally, the obtained information has to be presented or analysed. Traditionally this happened by the means of paper maps, but nowadays digital with an interactive map based on a database (Geographic Information System).
Finally, the obtained information has to be presented or analysed. Traditionally this happened by the means of paper maps, but nowadays digital with an interactive map based on a database (Geographic Information System).